I completed a Machine Learning course by Andrew NG on Coursera nearly 2 months ago, a course with an enrollment of 1.7mn people apparently. Not sure what the ‘course completion %’ is, though. Thanks to the course, I was able to revise some basics, primarily the math and intuition behind Machine Learning models. After you build a model, one of the important metrics by which people judge your model is the model accuracy. The problem is that there are so many of these evaluation metrics that quite often someone asks me to give a feedback on my model using a different accuracy metric.
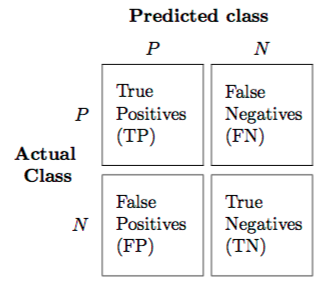
In a typical classification problem solved using Machine learning techniques, the outputs can be represented in a 2x2 matrix form which is called the ‘Confusion matrix’, shown below:-

1) Sensitivity = TP/(TP+FN) = TP/P
A useful metric when you are interested in predicting the positives right. Tests in Medical diagnosis are a good example. We wish to have as less false negatives as possible, i.e., no room for non-identification of a disease when the test is conducted.
2) Specificity = TN/(TN+FP) = TN/N
A useful metric when you wish to have the negatives right. Follow-up tests in Medical diagnosis are the best example. We don’t want to start treatment on people who don’t have the disease in the first place.
3) Precision = TP/(TP+FP)
A metric that tells you how precise is your prediction on the positives.
4) Recall = Sensitivity
Another fancy name for Sensitivity.
5) True Negative% = Specificity*100
Just a different name for Specificity.
6) True Positive% = Recall*100
Again, just a different name for sensitivity but more intuitive.
7) Accuracy = (TP+TN)/(TP+FN+FP+TN)
Helps to know what percentage of the predictions are correct. The limitation of this metric is in the cases of rare events. Say for example, 1% of the population has heart related diseases and the model predicts that none of them have heart diseases, the accuracy of the model will still be 99%.
8) F1-score = (2*Precision*Sensitivity)/(Precision+Sensitivity)
A good metric because it penalizes if you have got either high False positives or False Negatives.
Of course, we would like to have all these metrics as high as possible (close to 1 / near 100%) and that simply means our model is very good. The thing to wonder about is that if this 2x2 matrix can create so many evaluation metrics (many not shared above), how sophisticated/complicated is this evaluation business!